







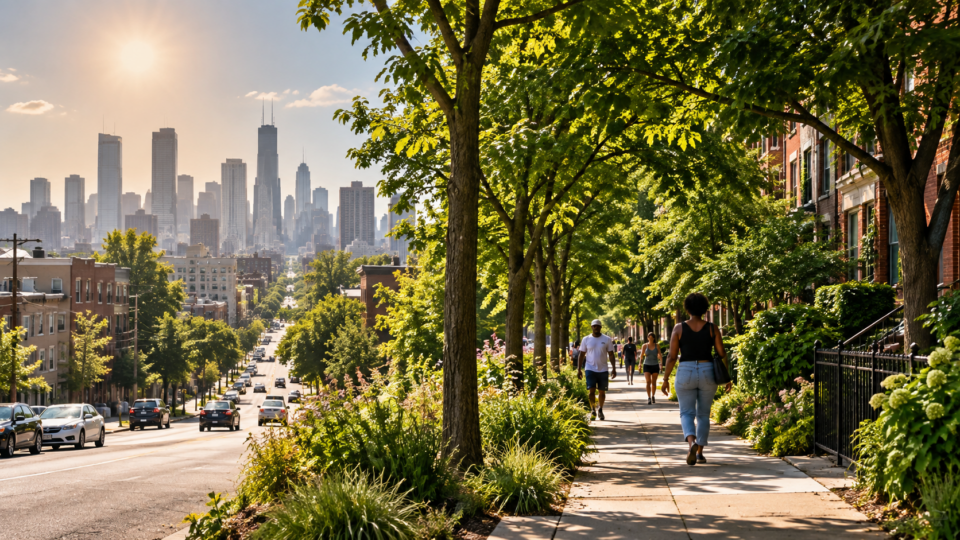
Heat inequality in cities is often described as a fixed consequence of decades of uneven development. Lower-income neighbourhoods tend to have less vegetation, more heat-absorbing surfaces and fewer resources to cope with extreme temperatures. A new long-term analysis suggests that this gap can change, and in many major US cities it has been moving in a more equal direction.
Researchers tracked environmental conditions across 55 major US cities from 1986 to 2020, comparing lower- and higher-income neighbourhoods over more than three decades. The analysis found that urban heat disparities generally narrowed over the study period, alongside faster environmental improvement in disadvantaged neighbourhoods. The strongest signal came from greenness: changes in greenness disparities were more closely associated with changes in heat disparities than changes in how efficiently vegetation produced cooling.
The result is encouraging, but it is not evidence that urban heat inequality has disappeared. Substantial differences remained, and the direction of change varied by climate. Temperate and cold cities were more likely to show narrowing heat gaps, while arid cities more often experienced persistent or widening disparities.
Published in Nature Communications on 5 October 2026, the study offers an unusually long view of environmental inequality. Rather than asking only which neighbourhoods are hotter today, it asks whether the distribution of heat exposure has been getting fairer or less fair over time.
Heat inequality is dynamic, not fixed
Urban heat is shaped by a combination of regional climate, buildings, roads, vegetation and the physical structure of neighbourhoods. Those factors are not distributed evenly. Previous research has repeatedly documented hotter conditions in socioeconomically disadvantaged communities, but a single snapshot cannot reveal whether those inequalities are widening, narrowing or simply moving with the city as a whole.
Jie Cao, Weiqi Zhou, Timon McPhearson and colleagues therefore examined trajectories rather than one-time differences. Their study covered 55 major cities across the United States and followed changes between 1986 and 2020. The researchers compared environmental conditions between neighbourhoods at different income levels, focusing on surface heat, greenness and the cooling relationship between vegetation and temperature.
That distinction is important. A city can become greener overall while inequality worsens if most new vegetation appears in affluent neighbourhoods. Conversely, environmental conditions can improve faster in disadvantaged areas even while those areas remain hotter in absolute terms. Measuring both the overall environmental trend and how change is distributed between income groups makes it possible to separate progress from equality.
The heat gap generally became smaller
Across the 55-city sample, the broad pattern was a narrowing difference in heat between lower- and higher-income neighbourhoods over the 34-year period. The narrowing coincided with faster environmental improvements in disadvantaged neighbourhoods, particularly larger increases in greenness.
This does not mean low-income neighbourhoods became cooler than affluent ones. The study explicitly reports that substantial inequities persisted. The key finding is about the trajectory of the gap: in many cities, disadvantaged neighbourhoods improved faster from their starting point.
That matters for how urban inequality is interpreted. If heat disparities were treated as a permanent feature of the built environment, policy would be largely about coping with an inherited problem. Evidence that the gaps can narrow suggests that land-cover change, greening and other urban interventions can alter the distribution of heat risk over time.
Greenness stood out more strongly than cooling efficiency
The researchers separated two related ideas. The first is how much vegetation a neighbourhood has. The second is cooling efficiency, or how strongly that vegetation is associated with lower surface temperatures. Those are not the same thing. A tree or patch of vegetation can provide different cooling effects depending on climate, water availability, surrounding surfaces and urban form.
Changes in greenness disparities were more strongly associated with changes in heat disparities than changes in cooling-efficiency disparities. In other words, the long-run shift in who had access to vegetation aligned more closely with the changing heat gap than shifts in how efficiently that vegetation cooled its surroundings.
This does not prove that greening caused the reduction in heat inequality. The study is observational, and urban neighbourhoods change in many ways simultaneously. But the relationship strengthens the case for treating the distribution of green infrastructure as an equity issue rather than simply measuring citywide canopy or vegetation totals.
Climate changed the pattern
The national average concealed important regional differences. Temperate and cold cities tended to show narrowing heat disparities, whereas arid cities were more likely to show persistent or widening gaps.
That finding is particularly important for climate adaptation because greening is not a uniform intervention. In water-limited environments, vegetation faces different ecological and infrastructure constraints. Irrigation requirements, drought tolerance, species selection and the availability of existing green space can all shape what is feasible.
The study therefore argues against a simple policy formula in which every city pursues the same greening target. The environmental mechanism that helps close a heat gap in a humid or temperate city may be harder to reproduce in an arid one, or may carry different water and maintenance costs.
Cities followed different pathways to greater or lesser equality
Another strength of the analysis is that it did not reduce every city to a single national trend. At city level, environmental disparities followed different trajectories depending on both the overall direction of environmental change and how that change was distributed between income groups.
Consider two cities that both become greener. In the first, lower-income neighbourhoods gain vegetation faster, reducing the greenness gap. In the second, affluent neighbourhoods gain vegetation faster, potentially increasing inequality despite a greener city overall. A citywide average would classify both as environmental improvement, even though their equity outcomes are very different.
The same logic applies to heat. A city can cool overall while leaving its most vulnerable communities behind. It can also warm overall while the relative gap between income groups narrows. The researchers’ trajectory-based approach makes those distinctions visible.
Why the result matters beyond the United States
The study focuses on US cities, but the underlying planning problem is global. Rapidly growing cities must decide not only how much green infrastructure to create, but where to place it and who benefits.
For South African cities, the question is especially relevant because urban form and historical spatial inequality can place very different environmental conditions within the same metropolitan area. Heat adaptation that is evaluated only at city level can miss whether investment reaches neighbourhoods with the greatest exposure and least capacity to adapt.
The new findings also complement Research Today’s recent coverage of park health returns in Greater Tokyo. That study showed that the value of urban green space depends strongly on location and accessibility. The US heat analysis adds another dimension: the distribution of greening can also matter for whether environmental inequality narrows over time.
Greening is not automatically equitable
It would be easy to read the findings as a simple endorsement of planting more trees. The evidence is more nuanced. The researchers found an association between faster greening in disadvantaged neighbourhoods and narrowing heat disparities, but equitable climate adaptation depends on where, how and for whom greening occurs.
Urban greening can also create trade-offs. Better environmental amenities may increase neighbourhood desirability and property values, potentially creating affordability pressure for existing residents. Vegetation requires maintenance, and in dry climates it may compete for scarce water. Tree species, canopy structure and the amount of impervious surface around vegetation can also influence cooling performance.
The study’s emphasis on trajectories helps expose this complexity. A successful greening programme should not be judged solely by total vegetation added. Planners also need to ask whether environmental improvements are reaching disadvantaged communities and whether the resulting benefits persist.
The study cannot prove that greening caused the narrowing
The research is a longitudinal observational analysis, not a randomized experiment. That means it can identify how heat, greenness and income-related disparities changed together, but it cannot establish a simple causal chain in which additional vegetation alone produced the observed narrowing.
Neighbourhoods change through redevelopment, population movement, housing investment, infrastructure upgrades and shifts in land use. Income patterns can also change over decades, meaning the social composition of a place is not necessarily constant from 1986 to 2020.
Surface-temperature measures also capture a specific dimension of heat exposure. They are valuable for mapping spatial differences, but human heat risk additionally depends on air temperature, humidity, time spent outdoors, housing quality, access to cooling, health status and occupational exposure.
The 55-city sample is broad but does not represent every US settlement, and the findings should not be mechanically transferred to cities in other countries with different climates, urban forms and histories of inequality.
A better way to measure climate adaptation
The central contribution is methodological as much as environmental. Climate adaptation is often assessed by asking whether conditions improved. The study shows why cities should also ask how the distribution of those improvements changed.
Across 55 major US cities, lower-income neighbourhoods generally made faster environmental gains and heat disparities narrowed between 1986 and 2020. Yet the remaining inequalities, and the contrasting trajectories in arid cities, show that progress is neither complete nor automatic.
For policymakers, the implication is straightforward: citywide greening totals are not enough. Tracking who gains vegetation, who remains hottest and how those gaps change through time provides a more meaningful test of whether climate adaptation is becoming more equitable.
Source Information
Study: Cao, J., Zhou, W., McPhearson, T. et al. “Narrowing urban heat disparities alongside faster greening in low-income neighborhoods across cities in the United States.”
Journal: Nature Communications.
Published: 5 October 2026.
DOI: 10.1038/s41467-026-78468-y
Study design: Longitudinal observational analysis of heat, greenness and socioeconomic disparities across 55 major US cities from 1986 to 2020, including comparisons across climate zones and analysis of changes in greenness and cooling-efficiency disparities.
Competing interests: The authors declared no competing interests.