



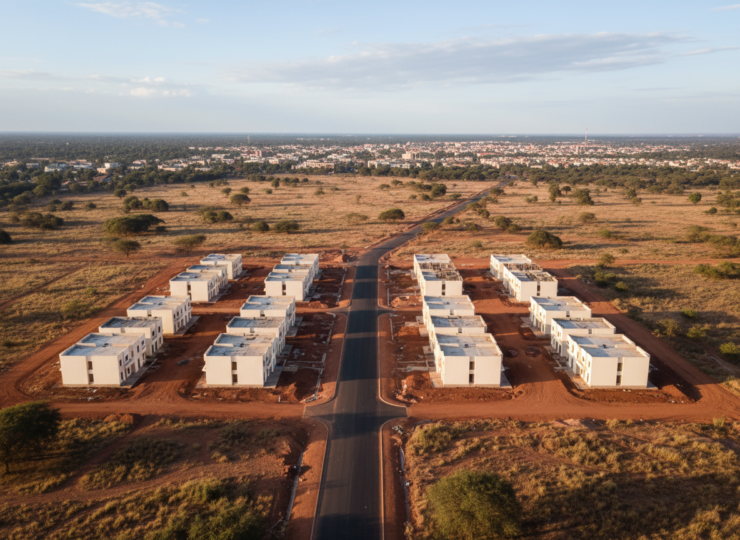



Dodoma’s transformation from a relatively compact administrative centre into a rapidly expanding capital is visible from space. A new peer-reviewed study has now reconstructed three decades of that growth and used machine learning to estimate where the city may be heading next.
The analysis, published in Scientific Reports, found that built-up land accounted for just 0.63% of the study area in 1996. By 2026, that share had climbed to 14.32%. If the land-use dynamics represented in the researchers’ model continue, built-up land is projected to occupy 25.53% by 2046.
That is not simply a story about more buildings. It is a governance problem involving where housing, roads and services are placed, how quickly planning can respond to settlement pressure, and whether growth consumes land in patterns that make future infrastructure more difficult and expensive to provide.
A capital city growing into a different spatial form
Researchers Pascal Mlaga and Nelly Babere of Ardhi University examined urban expansion in Dodoma, Tanzania, where the concentration of national administrative functions has intensified development pressure. Their central question was not only how much the city has expanded, but how historical land-cover change, accessibility and physical geography can be combined to anticipate future expansion.
The study matters because fast urban growth creates a timing problem for government. Roads, drainage, schools, utilities, public transport and protected open space are easier to plan before fragmented development becomes established. Once settlement has spread, retrofitting those systems can become considerably more complicated.
Rather than treating urbanisation as a single citywide percentage, the researchers approached it spatially. They asked which parts of the landscape had changed, which conditions were associated with those transitions and which locations appear more susceptible to future sprawl.
Four satellite snapshots across 30 years
The team used multi-temporal satellite imagery representing 1996, 2006, 2016 and 2026. The landscape was classified into four land-use and land-cover categories: water, built-up land, vegetation and bare land.
Classification quality varied across the four observation years. Overall accuracy ranged from 75% to 95%, while Kappa coefficients ranged from 0.66 to 0.93. Those figures are important because every later projection depends on the reliability of the historical maps used to describe change. The range also reminds readers that remotely sensed land-cover classification is an estimate rather than a perfect census of every parcel.
The researchers then used a Random Forest machine-learning approach to derive transition potential. In practical terms, the model learns from historical spatial patterns to estimate where land is more or less likely to change state. Those transition potentials were fed into a cellular automata and Markov, or CA-Markov, framework to simulate future land-use patterns for 2036 and 2046.
This combination addresses two related questions. The Markov component estimates the likelihood of movement between land-cover states based on observed transitions, while the cellular automata component helps allocate change spatially by considering neighbourhood relationships. Random Forest adds a flexible way to capture non-linear relationships between development and its potential drivers.
Built-up land rose from 0.63% to 14.32%
The clearest historical result is the scale of the built environment’s expansion. Built-up land increased from 0.63% of the study area in 1996 to 14.32% in 2026.
Put differently, the 2026 built-up share was more than 22 times the 1996 share. That comparison describes the change in proportional land coverage, not a 22-fold increase in population and not a measure of economic output. It shows how dramatically the physical footprint represented by the satellite classifications changed over the 30-year period.
The modelling suggests that expansion may continue. Built-up land is projected to reach 25.53% of the study area by 2046. Relative to the 2026 share, that would represent an additional 11.21 percentage points of the landscape becoming built-up within two decades under the modelled trajectory.
For planners, percentage points translate into spatial choices. A city can accommodate additional development through relatively compact growth, fragmented peripheral expansion, corridor development or combinations of these patterns. Those forms can impose very different demands on transport, utility networks and public-service delivery even when the total amount of new built-up land is similar.
Population, terrain and roads shaped where expansion occurred
The Random Forest analysis identified population density, elevation and road accessibility as the dominant drivers of urban expansion.
Each has a plausible planning interpretation. Population density captures where human settlement pressure is already concentrated. Elevation represents a physical constraint because terrain affects the practicality and cost of development. Road accessibility reflects the powerful role of transport networks in opening land to residential, commercial and institutional uses.
Importantly, a machine-learning importance ranking should not be read as a causal experiment. The model identifies variables that were useful for predicting observed spatial transitions. It does not prove that changing one factor by itself would produce a specified amount of urban expansion.
Road access illustrates that distinction well. Development may follow roads because roads improve accessibility, but roads may also be built where development pressure already exists. Both processes can operate together. The value of the model is therefore strongest as a spatial planning and forecasting tool rather than as proof of a single causal mechanism.
The future simulations performed strongly, but not perfectly
The researchers report area under the receiver operating characteristic curve, or AUC, values of 0.906 and 0.844 for the future simulation framework associated with the 2036 and 2046 scenarios. AUC measures how well a model discriminates between locations that are more and less likely to experience the modelled outcome. A value of 0.5 would indicate no discriminatory ability beyond chance, while values closer to 1 indicate stronger discrimination.
Values above 0.8 therefore indicate substantial predictive discrimination in this application. The decline from 0.906 to 0.844 is also intuitively important. Longer-range forecasts accumulate uncertainty because they extend current transition relationships further into a future in which policies, infrastructure, migration, economic conditions and environmental constraints may change.
The 2046 map should consequently be understood as a scenario generated from the model and its assumptions, not as a literal map of what Dodoma will inevitably look like in 20 years.
About 12% of the area fell into medium-to-high sprawl risk
The study also translated its spatial analysis into an urban-sprawl risk map. More than 52% of the study area was classified as low risk, while approximately 12% fell into medium-to-high risk categories that the researchers identify as requiring planning attention.
This is potentially more actionable than a citywide forecast. A planning authority does not need to treat every hectare as equally urgent. Spatial risk maps can help focus monitoring, infrastructure sequencing and development-control capacity on areas where transition pressure is more concentrated.
That does not mean low-risk land can be ignored. Risk classes are model outputs based on the variables and historical relationships available to the researchers. A new road, major public project, regulatory change or unexpected settlement pattern could alter development pressure in ways that historical data cannot fully anticipate.
Why this is a governance story as much as a mapping story
The technical contribution is the integration of satellite classification, Random Forest modelling and CA-Markov simulation. The policy contribution is the ability to turn decades of observed land change into a forward-looking map of where governance may be tested next.
For a rapidly expanding capital, anticipatory planning can affect whether future neighbourhoods emerge with access to transport and public services or whether infrastructure is forced to catch up after settlement. It can also help authorities identify areas where preserving vegetation, managing bare land conversion or coordinating road investment may become increasingly important.
The results also show why urban-growth governance cannot be separated from transport policy. Road accessibility emerged among the dominant predictive factors. Decisions about road placement can therefore interact with land markets and settlement patterns, potentially reshaping the geography that later rounds of planning must manage.
What the model cannot tell us
Several limitations are important when interpreting the findings. First, satellite classification is imperfect. Overall accuracy varied from 75% to 95%, meaning uncertainty in the historical maps can propagate into subsequent modelling.
Second, predictive importance is not causality. Population density, elevation and road accessibility helped the model distinguish development patterns, but the study does not establish experimental causal effects for those variables.
Third, CA-Markov projections extend relationships observed in the past. They cannot know in advance whether future zoning, infrastructure projects, land-market shocks, climate pressures or policy interventions will fundamentally change those relationships. The further the forecast extends from the observed period, the more cautiously it should be interpreted.
Finally, a land-cover model can identify where physical expansion is likely, but it cannot by itself determine whether that growth will be socially inclusive, affordable or well serviced. Those outcomes depend on institutions, investment, land rights and policy choices that require additional evidence beyond satellite imagery.
A warning that can still change the outcome
The most useful urban forecast is not necessarily the one that comes true. If a model identifies areas at elevated risk of fragmented expansion and planners intervene early, the resulting city may deliberately diverge from the forecast.
That is the practical value of this research. Dodoma’s built-up footprint has already changed sharply, rising from 0.63% of the study area in 1996 to 14.32% in 2026. The projection to 25.53% by 2046 is therefore less a prediction to wait for than a scenario against which current planning decisions can be tested.
For fast-growing African cities, the broader lesson is that machine learning and satellite records can help governments see development pressure before it is fully built into the landscape. The difficult part remains converting that information into timely land-use decisions, infrastructure investment and enforceable plans.
Source Information
Study: Machine learning and GIS-based spatiotemporal prediction of urban sprawl in a rapidly growing African city: a case study of Dodoma, Tanzania
Authors: Pascal Mlaga and Nelly Babere
Journal: Scientific Reports
Published: 27 September 2026
DOI: 10.1038/s41598-026-72628-2
Study type: Multi-temporal satellite land-use analysis with Random Forest modelling and CA-Markov spatial simulation