







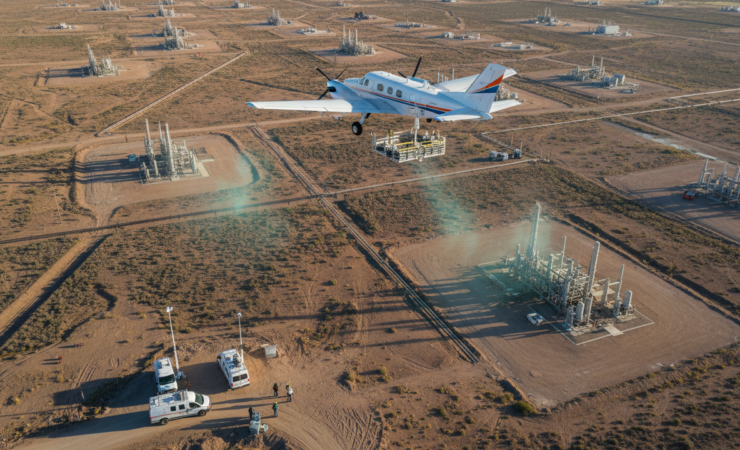
Methane measurement campaigns are increasingly used to build more realistic inventories of emissions from oil and gas production. But a new study suggests that a statistical feature of methane pollution can make those inventories much harder to construct than a simple sample-size calculation might imply.
William S. Daniels and Dorit M. Hammerling analysed emission-rate distributions from six major US oil and gas basins and found that rare, exceptionally large sources can exert an outsized influence on the estimated average. In several basins, keeping the error from a single measurement campaign within 10% of the true mean at a 95% confidence level required sampling more than 80% of sites.
The findings, published in Communications Earth & Environment on 3 October 2026, challenge the idea that the same sampling strategy can be applied across oil and gas regions. Instead, the number and relative size of super-emitters in each basin can determine how much measurement coverage is needed.
Why methane averages are unusually difficult to estimate
Methane emissions from oil and gas infrastructure are not evenly distributed. Many facilities emit relatively little, while a small number of sources can release exceptionally large quantities. Statistically, this produces a strongly right-skewed, heavy-tailed distribution.
This matters because measurement-based inventories rarely observe every possible source continuously. Researchers instead measure a sample of sites and use the resulting average emission rate to estimate emissions across a larger population. If a sample misses rare super-emitters, the average can be too low. If it happens to include an unusually influential super-emitter without enough ordinary sources to balance its effect, the average can be too high.
The problem is therefore not simply whether a campaign collects many measurements. It is whether the sample adequately represents both the large mass of ordinary emitters and the extreme tail of the distribution.
Testing sampling behaviour across six basins
The researchers examined previously published methane emission-rate distributions covering six US oil and gas basins. Rather than assuming a conventional probability distribution, they repeatedly sampled directly from the empirical basin-level distributions.
For each distribution, the team drew 1,000 samples without replacement at sample sizes ranging from a single measurement to the full population. They then compared each sample mean with the true mean of the underlying distribution.
Three metrics captured different aspects of sampling performance: the median percentage error across repeated samples, the maximum percentage error, and the probability that a single sample mean fell within 10% of the true mean. The final measure is especially relevant to real measurement campaigns because a field campaign typically produces one realised sample rather than thousands of repeated samples from the same population.
The analysis also compared two sets of reference emission distributions. This allowed the researchers to test how differences in the shape of the underlying emissions data changed the amount of sampling required.
A single extreme emitter can reshape the result
The Denver-Julesburg basin illustrates the problem clearly. In one reference distribution containing about 7,000 observations, the largest source emitted 942 kilograms of methane per hour. When the researchers examined example samples of 200 observations, a sample that happened to contain this largest source overestimated the true mean by roughly an order of magnitude. Samples that missed the largest emitters instead underestimated the mean.
Even sampling half of the Denver-Julesburg distribution did not eliminate substantial uncertainty. At 50% coverage, the 95% interval for sample-mean error extended from approximately -15.0% to 15.3%, while the maximum error reached 23.0%.
The researchers then varied the magnitude of the largest emitter computationally. As the largest source accounted for a greater share of total emissions, samples covering less than half of the population became increasingly likely to underestimate the true mean. At the same time, achieving a high probability that one sample would fall within 10% of the true average increasingly required measuring nearly the entire population.
More than 80% coverage was required in several basins
The basin-level results showed why a universal sampling target can be misleading. Using one set of reference distributions, campaigns in the San Joaquin, Appalachian, Barnett and Uinta basins needed to measure more than 80% of sites to keep the error of a single sample below 10% at the 95% confidence level. Using the second set of distributions, the Denver-Julesburg basin also required more than 80% coverage to meet the same criterion.
These requirements were not identical across basins because super-emitters differed in both frequency and magnitude. A basin with more frequent super-emitters can, somewhat counterintuitively, make the average easier to characterise because a measurement campaign is more likely to encounter those large sources. Where extreme emitters are rarer, a campaign may need much broader coverage to represent the tail reliably.
This creates an important distinction between two measurement objectives. A campaign designed primarily to find and mitigate as many super-emitters as possible may benefit from concentrating measurements where such sources are common. A campaign designed to estimate the basin-wide average accurately may need more measurements in basins where super-emitters are rare and therefore easier to miss.
The underlying dataset changes the answer
The study also found substantial differences between the two published sets of basin distributions used as reference populations. In most basins, one dataset attributed a larger share of total emissions to sources below 100 kilograms per hour, while the other often assigned a larger share to the single biggest emitter.
Because the largest emissions disproportionately affect the sample mean, those differences translated directly into different sample-size requirements. This means that campaign design depends not only on the basin being measured, but also on how accurately the available reference data represent its true emissions distribution.
The result is a warning against treating a sample-size threshold as a universal property of methane monitoring. The appropriate target depends on the statistical structure of emissions in the specific population and on the amount of error a campaign is prepared to tolerate.
What the findings mean for methane monitoring
Direct methane measurements have become increasingly important because conventional activity-based inventories can underestimate emissions, particularly when abnormal or intermittent high-emitting events are poorly represented. The new analysis does not argue against measurement-based inventories. Instead, it shows why the design of those campaigns matters.
For regulators, researchers and companies, the practical implication is that broad numerical targets for the number of facilities to measure may provide false reassurance. Two campaigns with the same percentage coverage can have very different statistical reliability if the basins have different super-emitter profiles.
The researchers therefore advocate basin-specific sampling strategies. Their work also includes a web-based tool intended to reproduce the analysis and allow users to apply the same approach to their own emission-rate distributions.
Important limitations
The results describe sampling variability under the empirical distributions used in the study. Real-world methane emissions can change over time as equipment operates, malfunctions, is repaired or responds to production conditions. The simulations deliberately sampled without replacement to isolate sampling variability, so the reported requirements should not be interpreted as capturing every source of uncertainty in an operational inventory.
The analysis also demonstrates that conclusions depend on the reference distribution. Differences between published datasets for the same basin produced materially different sampling requirements. If the true distribution differs from the reference data used to plan a campaign, the required coverage may also differ.
Finally, the study focuses on estimating average emission rates. Other monitoring goals, such as locating individual high emitters rapidly, verifying repairs or estimating emissions over time, can require different sampling designs.
A statistical challenge with practical consequences
The central finding is that the rarest and largest methane sources can determine how trustworthy a basin-wide average becomes. More measurements generally reduce sampling uncertainty, but the amount of coverage needed can vary dramatically depending on the tail of the emissions distribution.
For some basins in the study, measuring a modest subset of facilities was not enough to guarantee an average within 10% of the true value. The requirement exceeded 80% coverage under the study’s strict single-sample criterion. That makes the composition of the sample, and not merely its headline size, central to credible methane inventories.
Source Information
Study: Future methane measurement campaigns require basin-specific sampling strategies
Authors: William S. Daniels and Dorit M. Hammerling
Journal: Communications Earth & Environment
Published: 3 October 2026
DOI: 10.1038/s43247-026-04089-4