








A Michigan river did not show a simple rise in antibiotic resistance genes as surrounding development increased. Instead, researchers found the greatest number of detected resistance genes at a midstream sampling site in two separate campaigns, even though the most urbanised site lay farther downstream.
At Inkster, investigators detected 31 antibiotic resistance genes in both 2024 and 2026. Rouge Park, where developed land accounted for 92.7% of the contributing watershed, had just 10 detected genes in those campaigns. The findings highlight why a map of urban development cannot substitute for direct water testing.
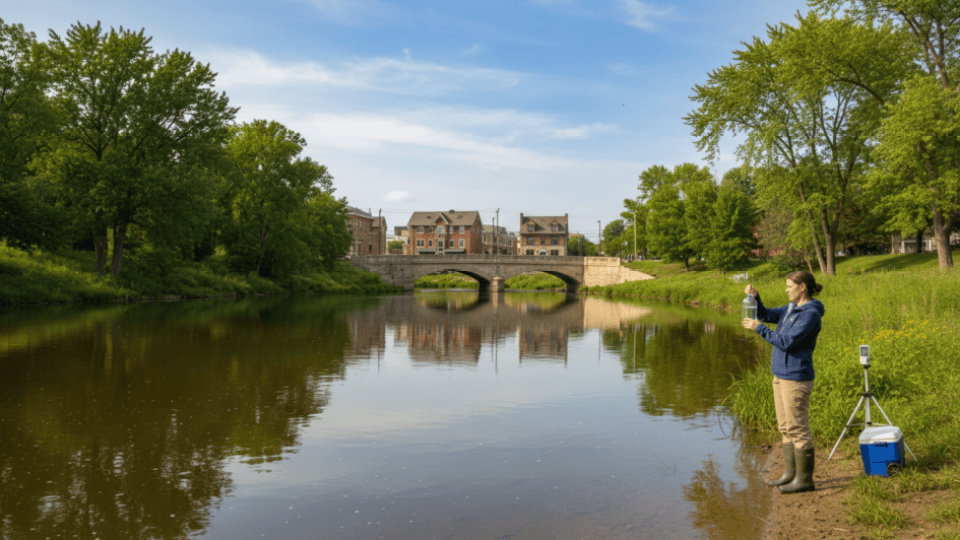
The study, published on 9 October 2026 in Frontiers in Microbiology, examined six sites in the Rouge River watershed of southeastern Michigan. It combined molecular testing, water chemistry and geographic information to investigate where resistance-associated DNA and microbial water quality markers appeared.
Why antibiotic resistance in rivers matters
Antibiotic resistance is often discussed in the context of hospitals, prescriptions and difficult-to-treat infections. But bacteria and resistance-associated genetic material also circulate through soil, wastewater, surface water, wildlife and other environmental systems.
A resistance gene is a DNA sequence associated with a mechanism that can help microorganisms withstand an antibiotic. Finding such a sequence in river water is evidence of genetic material, not proof that a swimmer or resident has been exposed to an infectious, drug-resistant pathogen.
That distinction is important because DNA-based laboratory tests can detect material from living cells, dead cells or DNA outside cells. Environmental surveillance can reveal patterns that warrant investigation, but it does not directly measure clinical infections. Related research on rivers near Johannesburg wastewater plants illustrates why different methods are needed to understand environmental resistance.
Urban rivers collect runoff from roads, neighbourhoods, industrial sites and green spaces. Their water quality may also reflect wastewater infrastructure, rainfall, upstream transport and sediments, making it difficult to attribute one finding to one land use.
A watershed with a substantial development gradient
The Rouge River watershed covers approximately 1,210 square kilometres in southeastern Michigan. Researchers selected six sampling sites along different river reaches: Canton, Venoy, Inkster, Ford Field, Dearborn and Rouge Park.
The proportion of developed land in each contributing watershed ranged from 46.3% at Canton to 92.7% at Rouge Park. Venoy was about 61.0% developed, Inkster 63.0%, Ford Field 67.5% and Dearborn 67.4%.
These percentages describe the broader drainage area feeding each location, rather than the appearance of the riverbank immediately beside a sampling point. A developed watershed may contain many potential inputs that vary with rainfall and drainage connections.
Inkster therefore occupied an intermediate position in the development gradient. Its recurring resistance-gene richness was not simply a reflection of being the most heavily built-up location.
How the researchers measured the water
Water samples came from three sampling campaigns conducted in 2023, 2024 and 2026. The researchers used high-throughput quantitative polymerase chain reaction, or qPCR, arrays to screen DNA associated with antibiotic resistance and microbial water quality.
The molecular approach allowed multiple targets to be assessed from the same samples. The researchers also considered physicochemical measurements and watershed characteristics, including land cover and hydrologic context.
For the resistance analysis, a target counted as positively detected when its quantification cycle was 35 or lower. A detected target was then included in the number of different resistance genes recorded at a site, a measure known as gene richness.
Richness counts the variety of targets detected. It does not tell readers the number of bacteria, whether those bacteria were alive, or whether a gene was present in a disease-causing organism.
The team examined resistance genes across several antibiotic classes, including beta-lactams, tetracyclines, vancomycin, aminoglycosides, fluoroquinolones and macrolides. They compared these profiles with microbial water quality markers and the measured environmental gradients.
The leading site changed after 2023
The results were not consistent with one permanent downstream peak. In 2023, Venoy had the greatest detected resistance-gene richness, with 25 genes, while Inkster had the fewest, with nine.
The pattern changed in 2024. Inkster rose to 31 detected genes, the highest among the six locations, while Rouge Park had 10, the fewest.
The same extremes appeared in 2026. Inkster again recorded 31 genes and Rouge Park again recorded 10, even though Rouge Park had the largest proportion of developed land.
For the 2026 campaign, Canton and Ford Field each recorded 21 detected genes, while Venoy and Dearborn each recorded 18. Those figures reinforce the absence of a straightforward increase from upstream to downstream.
The contrast between nine genes at Inkster in 2023 and 31 in each of the two later campaigns also cautions against treating one sampling visit as a permanent description of a location. River conditions and the material transported through them can change substantially.
What kinds of resistance genes were found
The researchers grouped positive detections by antibiotic resistance class. Beta-lactam resistance genes made the largest contribution to the overall detected profiles, particularly at Inkster and Dearborn in 2024 and 2026.
However, the array contained comparatively many beta-lactamase targets. A class with more targets has more opportunities to register detections, so raw class totals should not be interpreted as direct evidence that one resistance mechanism dominates the environment.
When detection frequency was normalised by the number of targets tested within each class, tetracycline-associated genes had the highest frequency. This gives a different, complementary perspective on which types of resistance-associated DNA were widespread.
Vancomycin resistance genes were detected at all six sites during the study period. Other classes showed greater variation across sites and sampling campaigns.
These patterns describe the specific genes included in the laboratory arrays. They do not represent an exhaustive catalogue of every resistance mechanism present in the river, nor do they establish that the water would defeat antibiotic treatment in a patient.
Why might Inkster repeatedly stand out?
The researchers considered several possible explanations for the recurring midstream peak. Inkster receives water from upstream areas and sits within an urban corridor where hydrologic connections may bring together material from different land uses.
Wastewater and stormwater inputs, sediments and local drainage could all contribute to what a sample contains. The study did not identify a particular pipe, facility or discharge as the source of the genes detected at Inkster.
Rainfall before sampling also differed. At Inkster, precipitation accumulated during the preceding 72 hours measured 20.83 millimetres in 2023, 4.83 millimetres in 2024 and 9.40 millimetres in 2026.
The higher richness in 2024 and 2026 occurred under different recent rainfall conditions. That observation suggests the 72-hour rainfall total alone cannot explain the repeated pattern, although it does not rule out more complex rainfall and transport effects.
The authors also noted that permitted combined-sewer systems operate within the wider corridor. That information provides useful context but is not evidence that a specific overflow caused the measured gene profile.
Water quality markers and resistance genes told different stories
A major feature of the research was testing two related kinds of molecular information in parallel. Microbial water quality markers can indicate organisms or contamination sources, while resistance-gene targets provide information about genetic determinants linked to antibiotic resistance.
The investigators asked whether both kinds of marker changed together with the same watershed characteristics and physicochemical measurements. Their results indicated substantial variation among locations and campaigns, but the two datasets did not respond identically.
The composition of microbial water quality markers was not significantly associated with the measured environmental gradients. Resistance-gene composition showed possible relationships in exploratory ordination analyses, but the overall relationship was not statistically significant after accounting for repeated observations at the same sites.
That qualification matters. A visually suggestive pattern on a statistical plot is not enough to conclude that developed land, temperature, water chemistry or another measured variable caused the resistance genes to appear.
The recurring Inkster finding is therefore a descriptive result that motivates further study. It is not proof of a causal link to urbanisation or any particular source of contamination.
What the findings mean for river monitoring
The study illustrates the value of sampling more than one location and returning across different years. Other research across 206 European ponds likewise highlights the importance of studying multiple aquatic sites, although it examined biodiversity rather than resistance genes. A programme focused only on the most urbanised downstream site could have missed the location with the greatest resistance-gene richness in two campaigns.
It also shows why conventional microbial indicators and resistance-gene measurements may be complementary rather than interchangeable. One set of markers cannot necessarily predict the distribution of the other.
For watershed managers, the practical implication is to consider targeted follow-up sampling at sites with recurring signals. More frequent sampling around rainfall events, wastewater discharges and seasonal changes could help narrow the possible explanations.
Such monitoring should also include measures that connect genetic detection to biological risk. Culturing organisms, identifying which species carry genes and assessing whether those organisms can transfer resistance would provide evidence that DNA arrays alone cannot supply.
The researchers frame this work within a One Health perspective, which recognises connections among human, animal and environmental health. Rivers can connect those systems, but surveillance findings need careful interpretation before they are used to make claims about health threats.
Why this does not mean the river is unsafe
The presence of resistance-associated DNA is not equivalent to a finding that river recreation causes antibiotic-resistant infections. The study did not measure infection incidence among people who contacted the water.
It also did not establish a threshold at which a count of detected genes makes a waterway safe or unsafe. The numbers describe richness of tested genetic targets, not a regulatory water-quality classification.
Public health decisions about swimming, fishing or drinking water require relevant exposure data, pathogen measurements and applicable local guidance. This molecular survey alone cannot replace those assessments.
Limitations of the evidence
The research included six sites and three sampling campaigns, providing valuable spatial and multi-year comparisons but limited resolution of day-to-day and seasonal changes. More frequent measurements would help distinguish persistent conditions from short-lived pulses.
High-throughput qPCR detects selected genetic targets rather than every possible resistance gene. Its results depend on the array design, detection threshold and the quality of environmental DNA recovered.
The richness measure does not show which organisms carried the genes or whether the genes were expressed. It also cannot establish how readily resistance might move between microorganisms.
Potential explanations involving sewer systems, runoff, sediments and hydrologic connections were not directly tested as causal mechanisms. The corrected multivariate analysis did not show a statistically significant overall association between resistance-gene composition and the measured environmental gradients.
Finally, the study concerns one Michigan watershed. Other river systems may differ in land use, treatment infrastructure, hydrology, agricultural inputs and climate, so its precise site rankings should not be generalised.
The next research questions
Repeated sampling at Inkster could test whether the 2024 and 2026 pattern persists across seasons. Pairing genetic screening with microbial cultures, flow measurements and source-tracking data could help identify where resistance-associated material originates.
Sampling upstream and downstream of specific infrastructure, while accounting for rainfall and flow, could test hypotheses more directly than comparisons of developed-land percentages alone. Such studies would still need to separate correlation from causation.
The main lesson is that environmental antibiotic resistance is spatially complex. In the Rouge River, the highest detected gene richness was not found at the site with the greatest overall urban development, and that mismatch is exactly why direct, repeated measurements matter.
Source Information
Study title: Urbanization shapes the landscape of antibiotic resistance genes and water quality microbial markers across an urban watershed
Authors: Mary Bustamante, Somtopchukwu Opara, Ali Hammoud, Jared Schneider, Kara Bowles, Keshav Pokhrel, Jacob A. Napieralski and Sonia M. Tiquia-Arashiro
Journal: Frontiers in Microbiology, volume 17
Publication date: 9 October 2026
Study design: Environmental observational study using qPCR molecular profiling, physicochemical measurements and watershed geospatial analysis
Study location: Rouge River watershed, southeastern Michigan, United States
Sampling: Six river locations across three campaigns in 2023, 2024 and 2026