







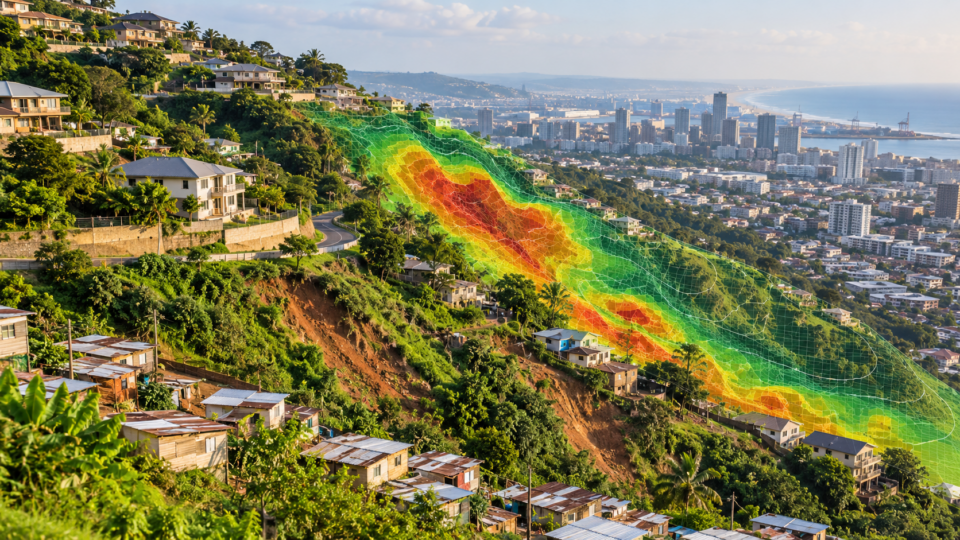

Landslides are often treated as hazards of steep, remote terrain, but in a densely developed city they can become an urban planning problem. Roads cut into slopes, buildings change drainage and loading, vegetation is removed, and people may live close to unstable ground. In eThekwini, where steep terrain and intense rainfall already create difficult conditions, knowing which areas are more susceptible can help planners focus attention before slope failure becomes a disaster.
A new peer-reviewed study published in Scientific Reports on 4 October 2026 applies machine learning and geospatial analysis to this problem across the eThekwini Metropolitan Municipality in KwaZulu-Natal. Researchers Cher Petersen, Paidamwoyo Mhangara, Laven Naidoo and Eskinder Gidey compared Random Forest and Support Vector Machine models to classify landslide susceptibility from very low to very high.
The strongest headline result is the models’ classification performance. Random Forest achieved an overall accuracy of 99.45%, while the Support Vector Machine reached 98.63%. The analysis also identified land use, elevation, vegetation condition and lithology as important influences on susceptibility. Built-up and cultivated land were associated with higher-susceptibility zones, pointing to a relationship between the physical landscape and human modification of it.
Why landslide susceptibility matters in a South African city
A susceptibility map does not predict the exact place and time of the next landslide. Instead, it estimates where the underlying conditions make slope failure more likely relative to other locations. That distinction is important. A high-susceptibility area is not guaranteed to fail during the next storm, while a low-susceptibility area is not guaranteed to remain stable forever.
For planning, however, relative susceptibility can still be valuable. It can guide more detailed geotechnical investigation, inform decisions about development and infrastructure, and help identify communities where monitoring or risk-reduction measures deserve greater attention. In a metropolitan area, the consequences of slope failure can extend beyond damaged land to roads, utilities, housing, displacement and loss of life.
The eThekwini study is particularly relevant because it connects physical hazard mapping with the built environment. Rather than stopping at a model-performance comparison, the researchers also examined how susceptibility overlapped with formal and informal housing.
Two machine-learning models tested the landscape
The researchers combined geospatial information on landslide-influencing factors with two established machine-learning approaches: Random Forest and Support Vector Machines. These methods are useful for susceptibility mapping because relationships between terrain, land cover and landslides are rarely simple or perfectly linear.
Random Forest builds an ensemble of decision trees and combines their classifications. This allows it to capture interactions among predictors without requiring researchers to specify one fixed linear relationship in advance. Support Vector Machines classify observations by finding boundaries that separate groups in a multidimensional feature space. Both methods are widely used in spatial prediction problems where multiple environmental variables interact.
The study incorporated key factors associated with slope stability and landslide occurrence and then converted the model outputs into susceptibility classes ranging from very low to very high. Among the variables highlighted by the results were land use, elevation, the Normalized Difference Vegetation Index, or NDVI, and lithology.
Each of these factors has a plausible physical connection to slope behaviour. Elevation helps describe the broader terrain context. Lithology captures differences in the underlying rock and geological material. NDVI provides information about vegetation condition and cover. Land use reflects how people have modified the surface, including development and cultivation.
Random Forest produced the higher accuracy
Both models performed strongly, but Random Forest had the edge. Its reported overall accuracy was 99.45%, compared with 98.63% for the Support Vector Machine. The authors also noted that Random Forest’s recall was slightly higher than its precision, a balance they considered useful for identifying landslide-prone locations.
For hazard screening, recall matters because a model that misses genuinely susceptible areas can create false reassurance. Precision matters too, because too many false alarms can waste resources. The preferred balance depends on how the map will be used. A screening tool may reasonably favour finding more potentially hazardous locations, followed by site-specific investigation, rather than treating the machine-learning classification as the final engineering decision.
The very high accuracy values should therefore be interpreted as evidence of strong performance within the study’s modelling framework, not as proof that future landslides can be predicted with near-perfect certainty. Susceptibility models learn from the data, variables and landslide information supplied to them. Their real-world value depends on how well those inputs represent future conditions and how the models perform when confronted with events outside the development data.
Human land use emerged as an important part of the hazard picture
The study’s importance extends beyond which algorithm won. Land use was one of the influential factors, and built-up and cultivated areas were associated with high-susceptibility zones. The researchers argue that human-engineered changes, including road and property development, can contribute to increased landslide susceptibility.
This does not mean that development automatically causes a landslide. Slope failure emerges from combinations of terrain, geology, water, vegetation and disturbance. But urban development can change several of those conditions at once. Cutting a slope for a road can alter its geometry. Construction can change loading. Stormwater systems can concentrate water. Vegetation removal can affect root reinforcement and surface runoff.
That makes susceptibility mapping potentially useful earlier in the planning process. If a proposed road, housing development or other project overlaps with terrain already classified as more susceptible, authorities can require closer geotechnical assessment before construction rather than responding only after visible instability develops.
Informal housing had a larger share in high-susceptibility zones
The researchers took the Support Vector Machine susceptibility output and compared it with the spatial distribution of formal and informal housing. Only a minority of either housing type fell within the high-susceptibility zones, but the proportions differed.
High-susceptibility zones contained 1.33% of formal housing and 2.41% of informal housing in the analysis. The absolute percentages are small, but the informal-housing share was roughly 1.8 times the formal-housing share. This is important because physical exposure is only one part of disaster risk. Housing quality, access roads, drainage, emergency access and the resources available for recovery can all influence what happens when a hazard becomes an actual event.
The result should not be interpreted as saying that all informal settlements are landslide-prone. The overwhelming majority were not classified within the high-susceptibility category in this analysis. Instead, it identifies a smaller subset where hazard information may be especially useful for targeted investigation and risk reduction.
What the maps can and cannot tell planners
The study offers a regional screening framework rather than a substitute for site-level engineering. Machine-learning susceptibility maps can help decide where to look more closely, but they cannot by themselves determine whether an individual building, road cutting or slope is safe.
There are also broader limitations to interpreting model accuracy. Spatial environmental datasets can contain correlations between nearby locations, and model performance can depend strongly on how training and evaluation samples are constructed. A model may perform exceptionally well at distinguishing mapped landslide and non-landslide conditions in the available dataset while still facing uncertainty when rainfall patterns, drainage, vegetation or urban development change.
The susceptibility classes also represent relative spatial conditions rather than a forecast tied to a specific storm. Rainfall intensity, duration and antecedent soil moisture can influence whether a susceptible slope actually fails. Those dynamic triggers need to be considered alongside the more persistent landscape characteristics represented in susceptibility mapping.
Why the study matters
For South African cities, the practical value of this work lies in combining modern spatial modelling with a local planning problem. eThekwini does not need to know only where landslides happened in the past. It needs tools that can help identify where combinations of terrain, geology, vegetation and human land use may create elevated susceptibility as the city continues to change.
The difference between 99.45% and 98.63% accuracy is less important than the broader finding that both machine-learning approaches were able to produce highly discriminating susceptibility maps from available geospatial factors. Random Forest performed slightly better, while the housing overlay showed how a hazard map can be connected to questions about who and what may be exposed.
The next step is not to treat the model as an automated planning authority. It is to use such maps as one layer in a larger risk-management system that includes updated landslide inventories, rainfall and drainage information, field inspection, engineering assessment and the realities of where people live. Used that way, machine learning can help turn scattered environmental data into a more focused question: which slopes deserve attention first?
Source Information
Study Title: Machine-learning modelling of regional landslide susceptibility in eThekwini, South Africa
Authors: Cher Petersen, Paidamwoyo Mhangara, Laven Naidoo and Eskinder Gidey
Journal: Scientific Reports
Published: 4 October 2026
DOI: 10.1038/s41598-026-73316-x
Research type: Regional geospatial landslide-susceptibility modelling using Random Forest and Support Vector Machines