







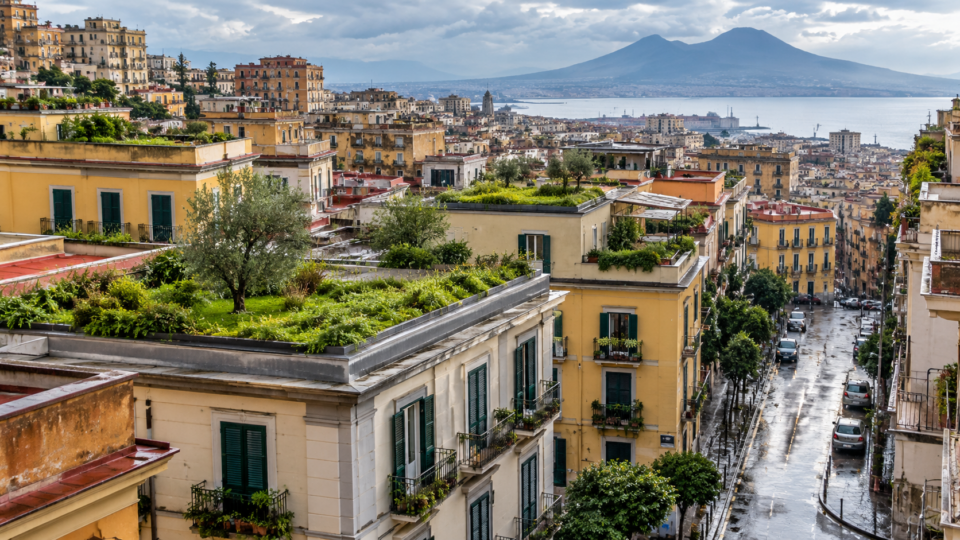
Green roofs may help protect more than the buildings that carry them. In a new modelling study of urban flooding in Naples, Italy, researchers tested a scenario in which 350 suitable residential buildings were fitted with vegetated roofs. The simulated intervention reduced the area covered by floodwater by 1.20% in the affected eastern catchment and moved 99 buildings into a lower flood-hazard category. More than half of those 99 buildings did not have green roofs themselves.
The findings, published on 8 October 2026 in the peer-reviewed journal Frontiers in Environmental Science, are encouraging but carefully bounded. These were computer-modelled outcomes, not observed improvements following a real installation programme. The study also found that the overall reduction in flooded area was modest, and that the benefits varied with drainage assumptions and location. Its central lesson is not that green roofs can solve urban flooding, but that carefully placed small interventions can spread some protection to surrounding streets and buildings.
Why a roof can affect flooding at street level
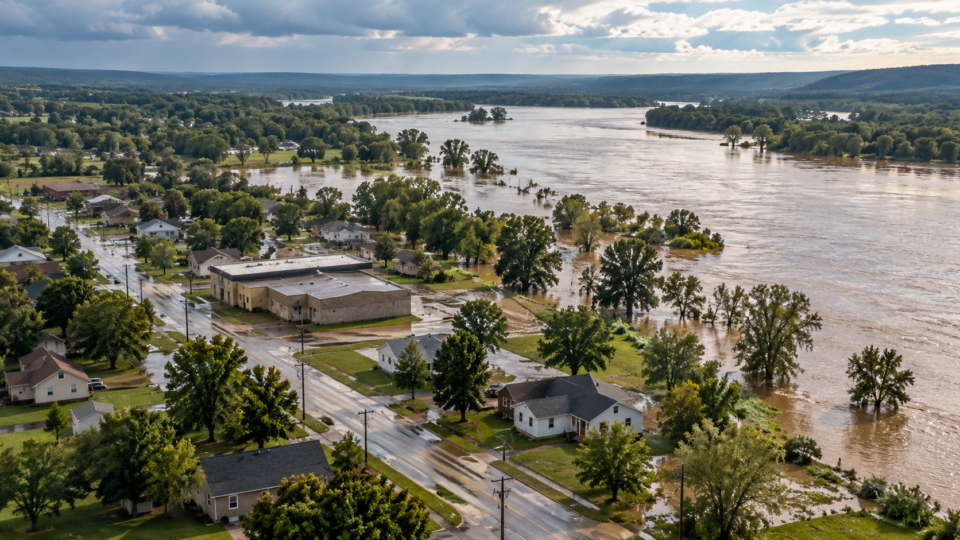
Rain falling on a conventional roof usually drains quickly into gutters, pipes and the surrounding stormwater network. During intense rainfall, drainage systems may be overwhelmed or blocked, leaving water to accumulate on roads and other low-lying surfaces. This is known as pluvial flooding: flooding caused directly by rainfall and surface runoff, rather than necessarily by a river overtopping its banks.
A green roof adds vegetation and a growing medium that can hold back some rainfall before water reaches the drainage system. Its effect depends on how much rain arrives, how much the roof can retain, and whether downstream drains still have capacity. A roof may make little difference to a very large storm while providing useful relief during more frequent events. The benefits can also occur downstream, because water retained upstream is water that does not immediately flow into a neighbouring street.
These interactions are difficult to quantify in old, densely built cities where detailed records of underground drainage pipes may be incomplete. Naples presents a demanding case: steep changes in elevation, narrow streets, historical buildings and a complex urban fabric shape where rainwater travels.
How researchers tested the idea
Nathalia Napolano and six colleagues from universities in Naples built a two-dimensional model of rainwater moving over the city’s urban surface. They used HEC-RAS version 6.7, a hydrodynamic modelling system, in a rain-on-grid configuration. The model combined terrain and building information, land cover, soil characteristics and rainfall inputs to estimate where water would accumulate and how deep it might become.
Rather than attempting to recreate every underground pipe, the team adapted the established Soil Conservation Service Curve Number method. Two parameters played different roles. The Curve Number describes the tendency of a surface to generate runoff, while initial abstraction represents rainfall retained or otherwise managed before surface runoff begins. The researchers adjusted the latter parameter to stand in for the amount of rainfall an urban drainage system could handle and for the interaction between green roofs and that system.
The model was first used to assess the wider city under synthetic rainfall events with a 10-year return period and durations of 30 minutes, one hour and three hours. A 10-year return period is a statistical description of rainfall probability, not a prediction that such a storm occurs only once every decade. The researchers then compared two scenarios in the eastern sector of Naples: a baseline without additional green roofs and a hypothetical intervention with them.
The green-roof scenario was deliberately selective. Researchers considered residential building type, age, construction, roof slope and area, excluding buildings where retrofitting would be less feasible or could conflict with architectural constraints. Eligible roofs had slopes of 0 to 15 degrees and areas between 300 and 1,500 square metres. The 350 selected buildings accounted for about 2.95% of the eastern sector’s 11,852 buildings, while the proposed green-roof area represented about 1.15% of that sector’s total area.
This matters because the study did not assume every roof could simply be planted. Its results reflect a constrained retrofit scenario, not a citywide maximum of what green infrastructure might theoretically achieve.
Flooded area fell by 1.20%, while water volume fell by 2.04%
In the eastern-sector comparison, the model estimated that the total flooded area declined from approximately 4.09 to 4.04 square kilometres after the hypothetical green-roof intervention. The more precise reduction was 49,288 square metres, equivalent to 4.93 hectares or 1.20% of the baseline flooded area.
Floodwater volume decreased by 7,721 cubic metres, a 2.04% reduction. The difference between the area and volume results suggests that some locations remained flooded but experienced slightly shallower water. Most affected model cells showed water-depth reductions of less than five centimetres. A smaller number of locations showed much larger local reductions, ranging from five to 60 centimetres, because topography can concentrate or redirect surface flow.
The broader baseline city model, before considering the eastern-sector intervention, estimated around 12.1 square kilometres of inundated non-built surface. That represented 12.4% of the city’s non-built urban surface in the simulated storm scenario. Most flooded areas were shallow, but a minority of locations experienced more substantial water depths. These citywide baseline figures should not be confused with the eastern-sector figures used to calculate the green-roof benefit.
The most revealing result was at building level
Researchers classified flood hazard around buildings according to modelled maximum water depth. Their three classes were H1, below five centimetres; H2, from five to below 20 centimetres; and H3, 20 centimetres or deeper. These are screening thresholds used in the paper, not guarantees that any particular depth is safe in every real-world situation.
Among 11,852 buildings in the eastern sector, 99, or 0.84%, shifted into a lower hazard category under the green-roof scenario. Specifically, 53 moved from H3 to H2, 42 moved from H2 to H1, and four moved directly from H3 to H1. Of those 99 improved classifications, only 43 belonged to buildings receiving a hypothetical green roof. The other 56 were neighbouring or downstream buildings.
This is the clearest illustration of the wider benefit. A building owner who pays for a green roof may not be the only person to benefit from its ability to delay or retain rainwater. Flood-risk reductions can travel through a catchment, potentially helping people who have not installed anything on their own properties.
There was also a small countervailing result: five buildings shifted into a higher hazard class, while 11,748 retained their previous classification. The authors suggest the five adverse changes could arise from timing and numerical effects in the model, including changes in when local flood peaks overlap. Reporting them is important because the intervention did not improve every simulated location.
How much does the result depend on modelling assumptions?
The researchers checked whether the apparent benefit survived changes to two influential parameters. In a separate one-hour synthetic storm analysis, they changed surface roughness by 10% in either direction and altered Curve Number values by five units. These changes substantially affected the absolute amount of simulated flooding. Yet the modelled reduction in floodwater volume attributable to green roofs remained close to 5,708 cubic metres across the tested configurations, while the reduction in flooded area remained between 0.05 and 0.06 square kilometres.
That stability supports the direction of the finding within the tested model. It does not eliminate uncertainty, because the researchers did not vary every possible input or fully validate the system against measured flood depths.
Drainage assumptions were more consequential. When the model was applied to a real rainfall event from 23 September 2023, assuming a drainage system with a lower nominal service level produced a larger apparent green-roof benefit. Under a one-year service-level assumption, the flooded area fell from 962,832 to 932,816 square metres, a 3.12% reduction. Under a two-year service-level assumption, the reduction was only 48 square metres, or about 0.012%. These are different scenarios, not contradictory estimates for the same set of conditions.
The result underlines a practical point: green roofs interact with conventional drainage rather than operating independently of it. Their measured contribution will depend partly on how much rainfall pipes and inlets can already accommodate.
What the model got right, and what it missed
To assess plausibility, the team compared a simulation of the September 2023 storm with photographs and videos posted by people in Naples. The model identified flooding at a road underpass and along a main road, partially reproduced inundation near tram tracks, and missed one documented flooded road location. The paper describes two matches, one partial match and one miss across four checked locations.
That comparison provides a useful reality check, but it is not the same as calibrating the model against a dense network of instruments measuring water depth and flow. The authors report that suitable urban hydrometric observations were unavailable. Blocked drains, temporary obstructions and small topographic details can create local flooding that a city-scale model cannot resolve.
The model also represented underground drainage indirectly and did not explicitly simulate the detailed storage-and-release dynamics of each green roof. It therefore cannot fully reproduce how an actual roof and drainage pipe network would delay flood peaks over time. Its strongest use is comparing possible interventions and locating promising areas for closer investigation, not predicting exact centimetres of water outside a particular building.
Why this matters for cities beyond Naples
The policy implications are broader than rooftop gardening. If green roofs help neighbouring buildings, private owners may have little financial incentive to pay for installations whose benefits are shared. Municipal subsidies, building incentives or strategically targeted retrofit programmes could be justified where local engineering assessments show a collective benefit.
The results also suggest that placement matters. Treating roofs upstream of flood-prone streets may deliver more benefit than spreading the same green-roof area evenly across a city. This is particularly relevant in dense urban areas with limited space for large parks, ponds or new drainage infrastructure. It does not mean green roofs should replace stormwater maintenance, drainage upgrades or other flood-prevention measures.
For South African readers, the transferability is methodological rather than numerical. Naples’ rainfall, terrain, buildings and drainage systems differ from those of South African cities. Research Today has previously covered how modelling can help identify landslide-susceptible areas in eThekwini. The hazards are different, but both studies show why city-scale risk maps should guide where limited adaptation resources are directed. Related work on urban greening and neighbourhood heat exposure illustrates another potential reason to evaluate green infrastructure as part of integrated planning, rather than judging a project on a single outcome.
The bottom line
This study does not show that 350 green roofs have already prevented flooding in Naples. It shows that, in a realistic but hypothetical retrofit scenario, a two-dimensional flood model estimated a modest 1.20% reduction in flooded area, a 2.04% reduction in floodwater volume and improved hazard classifications at 99 buildings. More than half of those improved buildings had no green roof in the scenario.
That combination is more useful than a simple success claim. The overall gains were small, local gains could be meaningful, and the benefits extended beyond the properties receiving the intervention. For urban planners, the study makes a case for carefully targeted green roofs as one component of flood management, with detailed local validation before any investment decision.
Source Information
Study: Pluvial flood risk assessment and nature-based mitigation in urban environments: a pragmatic Curve Number and Initial Abstraction approach.
Authors: Nathalia Napolano, Renata Della Morte, Luca Cozzolino, Maria Fabrizia Clemente, Valeria D’Ambrosio, Ferdinando Di Martino and Giada Varra.
Journal: Frontiers in Environmental Science, volume 14, Water and Wastewater Management.
Publication date: 8 October 2026.
Research type: Peer-reviewed original research; two-dimensional hydrodynamic modelling and hypothetical green-roof intervention scenarios for Naples, Italy.
DOI: 10.3389/fenvs.2026.1907724.