






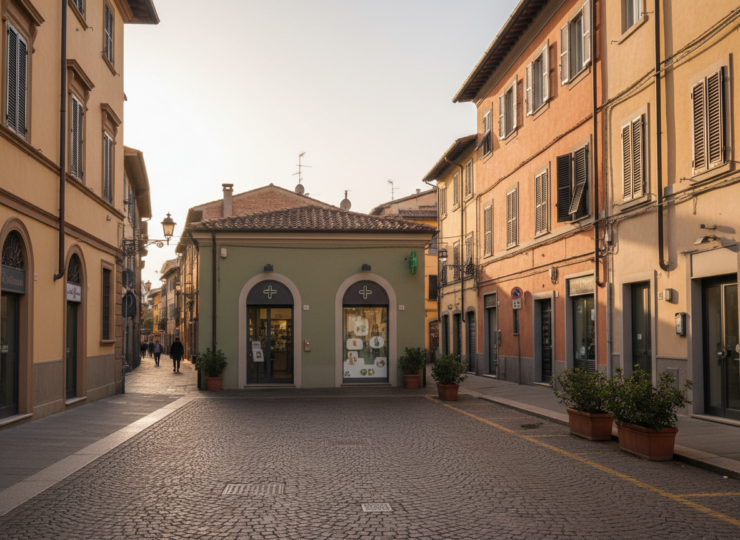

Living in a city with many pharmacies does not necessarily mean every neighbourhood has equal access to one.
That distinction matters in Italy, where the national pharmacy network is relatively dense but local access is shaped by population concentration, urban form and the way services are distributed within municipal boundaries. A new study comparing Milan and Taranto shows why a citywide average can conceal very different neighbourhood realities.
Researchers found that socio-economic deprivation was associated with pharmacy presence in opposite directions in the two cities. After accounting for other census characteristics, higher deprivation was positively associated with pharmacy presence in Milan but negatively associated with it in Taranto. At the same time, both cities showed strong geographic clustering of high deprivation, with residents in some peripheral areas facing a much less favourable local service landscape.
The findings, published in Social Indicators Research on 28 September 2026, make a broader point about urban inequality. Access to an essential service cannot be inferred from the total number of facilities in a city. Where those facilities sit, who lives around them and how neighbourhoods connect to one another can matter just as much.
Two cities offered very different tests of the same question
The researchers selected Milan and Taranto because they represent contrasting urban structures.
Milan is a dense northern metropolis with a concentrated commercial core, large commuter flows and substantial socio-economic variation between central and peripheral neighbourhoods. Taranto, in southern Italy, is more spatially dispersed and fragmented. Its urban geography has been shaped by industrial development, population decline and physically separated residential areas.
Those differences gave the researchers an opportunity to ask whether the same statistical relationship between disadvantage and pharmacy availability would appear in two very different cities.
It did not.
The team combined Italian census data, municipal open data and geographic information system mapping at the level of census sections. Pharmacy locations were mapped as geographic points and linked to the small areas in which they were located. The researchers then constructed measures of pharmacy density, inhabitants per pharmacy and socio-economic deprivation.
The deprivation measure was a modified Caranci index. It combined four standardised indicators: male unemployment, households without a car, overcrowded households and lower occupational social class. The result was a small-area measure designed to capture multiple dimensions of socio-economic hardship rather than relying on income alone.
Pharmacies clustered differently from people
The descriptive maps revealed a familiar urban-service problem. Pharmacies were not distributed simply in proportion to where residents lived.
In Milan, pharmacy density was highest in the historical and commercial centre and generally declined towards the outskirts. Several densely populated peripheral areas had higher numbers of inhabitants relying on each pharmacy, with some local ratios exceeding 4,000 residents per pharmacy. Other outer census sections contained no pharmacy at all.
Taranto showed a different geography. Rather than a strong centre-to-periphery gradient, pharmacy provision was scattered across a more fragmented urban landscape. Residential clusters such as Paolo VI and Tamburi contained gaps in local provision alongside sections with relatively high resident burdens.
This is important because pharmacy density is not merely a retail measure. Community pharmacies can function as accessible points of contact with healthcare, particularly for older people, people managing chronic conditions and residents who may face barriers to reaching other services.
A city can therefore perform well on a headline pharmacies-per-resident measure while still containing neighbourhoods where access is comparatively constrained.
Deprivation predicted pharmacy presence in opposite directions
The researchers moved beyond mapping by estimating separate binomial logistic regression models for pharmacy presence in Milan and Taranto. Each census section was coded according to whether it contained at least one pharmacy.
The models used the same six predictors in both cities, including the deprivation index, household structure, illiteracy and the proportion of foreign residents.
In Milan, the coefficient for the deprivation index was positive at 0.1449 and statistically significant at p<0.001. In Taranto, the coefficient was negative at -0.298, with p=0.008.
That reversal is one of the study’s most important findings.
It means the data do not support a simple rule that more deprived neighbourhoods always have fewer pharmacies. In Milan, greater deprivation was associated with higher odds of a census section containing a pharmacy after the other variables were taken into account. In Taranto, greater deprivation was associated with lower odds.
The wider urban context therefore changes what the same deprivation measure means for service geography.
Some relationships were more consistent. In both cities, a higher share of households with four or more members and a higher proportion of illiterate residents were significantly associated with lower pharmacy presence. The proportion of foreign residents, by contrast, was not statistically significant in either final pharmacy model, with p=0.772 in Milan and p=0.901 in Taranto.
Single-person households also behaved differently across the cities. Their prevalence was a significant negative predictor of pharmacy presence in Milan but was not significant in Taranto.
The models substantially improved on an intercept-only explanation
The Milan pharmacy model reduced deviance from 8,355.2 in the null model to 4,584.5 after the six predictors were included. The likelihood-ratio reduction was 3,770.7 on six degrees of freedom, with p<0.001. Its Akaike information criterion was 4,596.5.
For Taranto, null deviance was 1,608.4 and residual deviance fell to 1,387.2. The reduction of 221.2 on six degrees of freedom was also significant at p<0.001, while the AIC was 1,401.2.
The researchers also checked whether overlapping socio-economic predictors were creating unstable estimates. Variance inflation factors remained below conventional concern thresholds. In Milan they ranged from 1.87 to 2.34, and in Taranto from 1.65 to 2.11.
Those diagnostics strengthen the case that the included variables were capturing related but distinguishable dimensions of neighbourhood conditions.
Deprivation itself was intensely spatial
A second part of the analysis asked a different question: what predicts whether a census section belongs to the most deprived quarter of the city?
For this, the researchers used spatial autologistic models. The approach explicitly accounted for neighbouring census sections, recognising that urban deprivation tends to cluster geographically rather than appearing as isolated points.
The spatial effect was striking. A census section’s odds of being highly deprived were strongly associated with deprivation in adjacent sections. The spatial-lag odds ratio was 3.95 in Milan and 4.21 in Taranto, with both relationships significant at p<0.001.
In practical terms, disadvantaged areas were much more likely to sit beside other disadvantaged areas. This matters for service planning because a missing pharmacy in one section may not be offset by an easily accessible service immediately across its boundary if the surrounding neighbourhoods face similar constraints.
Large households were also associated with high deprivation in both cities. The odds ratio was 1.92 in Milan and 2.15 in Taranto. Single-person households again diverged: they were associated with higher odds of deprivation in Milan, with an odds ratio of 1.45 and p=0.002, but lower odds in Taranto, where the odds ratio was 0.78.
The researchers interpret this difference cautiously. A one-person household is not a uniform social category. In Milan it can include older people living alone and younger migrants in precarious housing as well as affluent professionals. In Taranto, the demographic composition is different. The same household statistic can therefore carry different social meaning in different cities.
Small geographic units changed an actual planning process
The study was not limited to describing inequality. In Taranto, the census-section framework was applied to a practical administrative problem involving the reorganisation of pharmacy service areas.
Previous population assignments had relied partly on street names and civic numbers. Ambiguous or duplicated place descriptions could produce disagreement over which residents belonged to a proposed service area.
The researchers replaced this approach with official census-section boundaries. Because each section has a defined geographic boundary and associated population, the method created a reproducible way to allocate residents to pharmacy zones.
The framework was subsequently used to support Taranto’s decentralisation process, including the assessment of proposed service areas in Talsano Sud, Taranto 2 and Paolo VI.
This applied element illustrates why geographic precision matters. A planning decision can look objective at municipal level while depending on surprisingly fragile assumptions about how neighbourhood populations are counted.
Urban averages can hide the policy problem
The broader implication is not that every neighbourhood requires the same number of pharmacies.
Demand differs with population size, age, mobility, commuting patterns and the availability of nearby services. Commercial viability also matters. A pharmacy located just outside a census boundary may still be easily accessible to residents within it.
But the research shows why planners should be cautious about treating a citywide pharmacy ratio as evidence of equitable access.
Milan and Taranto can both contain substantial local inequalities even though they operate within the same national healthcare and regulatory environment. More importantly, deprivation does not interact with pharmacy presence in the same way in both places.
That makes locally resolved data essential. Policies based on national or municipal averages may miss the census sections where disadvantage and limited service availability overlap most strongly.
The study measures presence, not the full experience of access
Several limitations are important when interpreting the findings.
First, pharmacy presence was binary. A section with one pharmacy was treated as having a pharmacy regardless of whether it contained 100 residents or 10,000. The mapping of inhabitants per pharmacy helps reveal this issue descriptively, but the main pharmacy-presence regression does not model facility capacity or workload.
Second, having no pharmacy inside a census section does not necessarily mean residents lack practical access. People can cross boundaries, and actual accessibility depends on distance, transport, walking routes, opening hours, mobility and service capacity.
Third, the analysis is observational and geographically specific. The coefficients describe associations within Milan and Taranto and should not be interpreted as evidence that deprivation causes pharmacies to open or close.
The study also relies on census-based socio-economic measures that cannot capture every contemporary neighbourhood change. Future work could model pharmacy counts directly, incorporate population offsets, use longitudinal data and test accessibility through travel times or network distance.
Equity requires knowing where services actually are
The central lesson is deceptively simple.
A service can be plentiful at city level and uneven at neighbourhood level.
For Milan, Taranto and other cities trying to plan essential community services, the relevant question is therefore not only how many facilities exist. It is whether their geography matches the geography of people, vulnerability and need.
The opposite deprivation coefficients in the two cities reinforce that point. Urban inequality is not governed by a universal spatial formula. The same social indicator can interact differently with service provision depending on how a city developed, where people live and how its neighbourhoods connect.
Fine-grained mapping does not solve that inequality by itself. It does, however, make it considerably harder for a favourable citywide average to hide it.
Source Information
Study Title: A Spatial-Statistical Framework for Analyzing Territorial Inequalities in Pharmacy Access: Integrated Evidence from Milan and Taranto
Authors: Stefano Cervellera, Maria Longobardi, Gianfranco Piscopo, Massimiliano Giacalone and Carlo Cusatelli
Journal: Social Indicators Research
Volume: 184, Article 54
Published: 28 September 2026
DOI: 10.1007/s11205-026-03941-6