






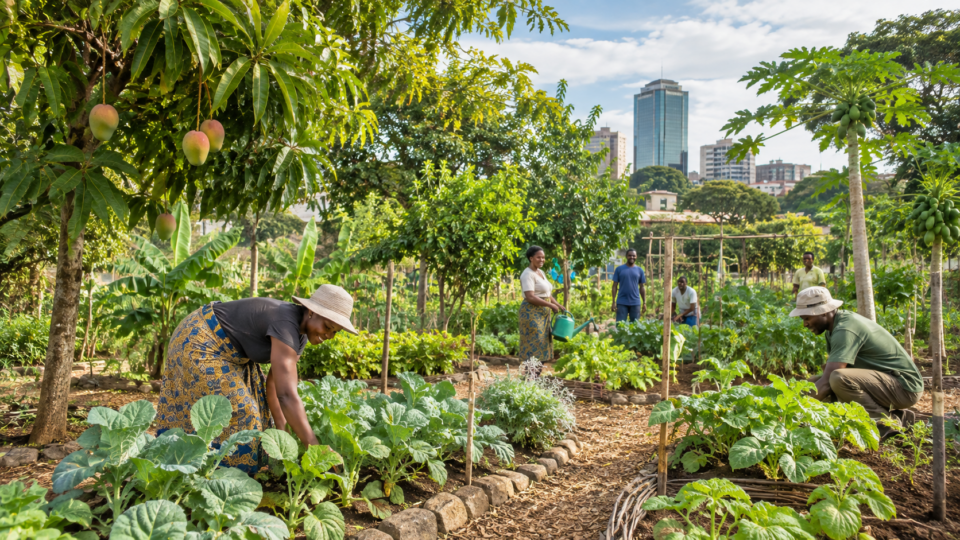
An orchard seen from orbit
Urban food production is often discussed through the number of gardens established or the amount of land set aside for growing.
But a garden’s existence does not guarantee healthy crops when rainfall becomes unreliable.
In Harare, Zimbabwe, a researcher has examined whether satellite imagery can reveal the environmental pressures acting on an urban orchard over time.
The approach treats vegetation as a changing system rather than a fixed patch of green on a map.
Geoffrey Mukwada’s study, published in Frontiers in Sustainable Cities on 18 August 2026, analysed environmental indicators for an orchard in Harare across a period described as 2013 to 2023.
It combined satellite-derived measures of vegetation and water with climatic information.
The central finding was that persistent dry conditions and limited environmental water availability were associated with signs of weaker vegetation health.
The paper does not claim that a satellite can count every fruit or identify the precise cause of each damaged leaf.
Its contribution is to show how repeated observations can support management of urban food forests where detailed ground monitoring may be difficult or costly.
Why urban food forests matter
Food forests are planted systems that combine trees and other useful vegetation, often with the ambition of producing food while providing shade, habitat and ecological benefits.
In cities, such spaces may supplement household food supplies and make productive use of land.
Their resilience depends on weather, soils, access to water and the decisions of people who maintain them.
The potential benefits are especially relevant in places where food prices, household incomes and changing rainfall create overlapping pressures.
An orchard can offer fruit or other products, but it may also require irrigation and labour at exactly the times when resources are scarce.
Understanding its response to drought is therefore both an ecological and a practical management problem.
The study focuses on one case rather than a national survey.
That narrow scope is useful for examining a place in detail, although it limits the extent to which the findings can be generalized to every urban farm in southern Africa.
Different crop species, soils and irrigation arrangements could produce different responses under similar weather conditions.
Three types of evidence, one changing landscape
The analysis used the Normalized Difference Vegetation Index, or NDVI, to examine the condition of vegetation. NDVI compares the way plants reflect different wavelengths of light.
Healthy green vegetation typically has a distinctive reflectance pattern, making the index useful for tracking broad changes in canopy condition.
Yet NDVI is not a direct measurement of yield, nutrient content or disease.
The researcher also used the Normalized Difference Water Index, or NDWI, as an indicator related to water conditions.
The paper reports persistently negative NDWI values, interpreted as a sign of limited water availability in the studied environment.
This matters because vegetation can remain visibly present even while its water supply is inadequate for sustained growth.
A third indicator, the Standardized Precipitation Evapotranspiration Index, or SPEI, helps characterize drought by considering the balance between precipitation and atmospheric demand for water.
Temperature and rainfall information supplied additional climatic context.
Together these measures offered a richer account than any single green-versus-brown satellite image could provide.
The work used Google Earth Engine for processing environmental information, with further correlation and multiple-regression analyses conducted in Excel.
The paper describes Sentinel-2 imagery for the vegetation and water indices, a global SPEI dataset and climate information from Climate Explorer.
These are analytical inputs rather than direct measurements made by a person standing beside every tree.
What the time series suggested
The study reported relatively low NDVI values across much of the analysed series, alongside persistently negative NDWI readings.
The author interpreted the combination as evidence that vegetation health was being constrained by limited water availability and recurring drought or dry spells.
These are linked environmental patterns, but the analysis cannot show that each fluctuation in vegetation was caused solely by climate change.
Urban orchards are affected by management choices as well as climate.
Irrigation may offset rainfall shortages, while changes in pruning, planting density or tree age can alter the canopy seen by satellites. A time-series association therefore needs interpretation within the local history of the orchard.
The study’s climatic indicators make drought a plausible explanation, but they do not eliminate every alternative.
The main contribution is the identification of a recurring stress pattern rather than one spectacular event. A short drought may be visible in a single season, whereas persistent water deficits can affect growth and productivity over years.
Monitoring repeatedly allows managers to ask whether a weak season is unusual or part of a longer deterioration.
Research Today has previously discussed changes in global land-water storage.
That work addresses a much broader scale, but it helps explain why water availability cannot be inferred from rainfall alone.
The Harare case brings the question down to the level of vegetation managed within a city.
What a satellite cannot tell a grower
Remote sensing offers repeated coverage and consistent measurements, but its indices are proxies. A green canopy might reflect vigorous growth, a particular species mix or even vegetation outside the productive orchard.
Low vegetation-index values can result from sparse planting, seasonal leaf loss or exposed soil, not only drought.
The relationship between spectral signals and actual harvest must be checked on the ground.
Spatial resolution is another constraint.
Satellite pixels combine information from the area they cover.
In a small or mixed urban site, trees, paths, roofs and bare ground can contribute to the same observation.
Cloud cover and differences between sensors can complicate comparisons across time.
The study’s methods provide useful patterns, not an error-free diary of each tree.
A reliable operational monitoring system would ideally connect satellite signals to field observations: soil moisture, irrigation records, crop condition and yields.
Such checks could show whether an alert corresponds to a problem a grower can address.
Without them, an index may identify unusual conditions without specifying the right response.
The distinction matters for technology investment. A visually attractive map is not necessarily a useful agricultural decision tool.
Its value depends on whether it changes the timing or quality of action in ways that help farmers conserve water or protect crops.
From environmental signals to practical decisions
Mukwada recommends exploring mobile applications that would make NDVI, NDWI and productivity information more accessible to urban farmers.
In principle, an application could alert users when vegetation signals deteriorate or when drought conditions intensify.
But the paper does not report a trial showing that such an application improved harvests or reduced costs.
That remains a proposal for future development.
A useful system would need clear explanations and realistic advice.
If an orchard is already short of water, telling its owner that vegetation is stressed may add little unless the alert can guide irrigation planning or prompt inspection.
The costs of data access, smartphones and technical support would also affect adoption.
Research Today has reported on the mixed outcomes of restoration programmes in Africa.
Although restoration and urban food production differ, both demonstrate that environmental interventions need follow-up evidence.
The number of sites established tells less than whether they remain healthy and productive.
For city authorities, monitoring could identify locations where drought resilience deserves investment.
It might also help evaluate whether changes in irrigation, planting or soil management produce visible improvements.
Such use should be accompanied by ground validation and safeguards against interpreting a single index as definitive.
A regional problem with local variation
Southern African climate variability can create challenging conditions for urban agriculture, but the experience of one Harare orchard cannot be extrapolated mechanically to every neighbourhood.
Elevation, soil depth, species selection, water access and management all matter. A different site might show stronger vegetation despite the same regional drought because it has reliable irrigation or more suitable planting.
The study’s timeframe and use of multiple environmental indicators make it more informative than a one-day image.
Still, long-term observational analysis does not prove that anthropogenic climate change caused every dry spell.
Attribution of particular weather patterns requires different methods.
The paper’s evidence is strongest for the association between local vegetation indicators and drought-related conditions.
A Research Today analysis of projected shifts in southern African summer rainfall provides a complementary perspective on regional climate uncertainty.
The Harare study examines environmental signals already observed around a specific urban food system.
The two approaches answer different questions and should not be conflated.
The value of monitoring before a harvest fails
Urban food forests will not become resilient simply because their leaves can be seen from space.
Resilience requires suitable species, practical water management and people who can respond when conditions deteriorate.
Satellite data can contribute by showing patterns that are difficult to detect from occasional site visits, especially when records are sparse.
The strongest lesson of this case is methodological: combining vegetation, water and drought indicators can reveal persistent stress in a productive urban landscape.
The findings justify further testing of accessible monitoring tools, but they do not establish a guaranteed increase in food production or a universal model for African cities.
Future research could compare multiple orchards, validate satellite indices against measured yields and test whether mobile alerts change growers’ decisions.
Such work would move from diagnosing a problem to demonstrating a solution.
For now, the Harare analysis illustrates how environmental information can make an overlooked form of urban infrastructure more visible—and how much work remains before visibility becomes reliable adaptation.
Source Information
Study title: Using multispectral imagery to monitor urban food forests in a changing climatic environment: a case from Zimbabwe
Authors: Geoffrey Mukwada
Journal: Frontiers in Sustainable Cities, volume 8
Publication date: 18 August 2026
Study design: Observational remote-sensing time-series case study with correlation and multiple regression
Sample or scope: An urban orchard in Harare, Zimbabwe; environmental indicators across 2013–2023
Key finding: Persistent negative water-index values and relatively low vegetation-index readings were associated with drought and dry spells in the studied orchard